

Multivariate time series forecasting and analysis of the US unemployment rate — Part 1

Multivariate time series forecasting and analysis of the US unemployment rate — Part 1

The unemployment rate is an important macroeconomic indicator that is monitored by US government agencies for the purpose of ensuring the proper functioning of the overall economy. Since the unemployment rate is the measure of joblessness in the economy, it is necessary to build better forecast models for unemployment. These models are also used by the government to implement policy changes to increase employment opportunities and reduce financial hardship on the unemployed during recession.
In this multi-part article, I will discuss the usage of classical time series methods such as Vector Autoregressive Models and different neural network architectures, specifically, Feed Forward Artificial Neural Networks and Recurrent Neural Networks, specifically, Long Short-term Memory Networks.
With these methods, we assess the improvement in forecasting of unemployment rates against their univariate time series equivalent as well as a benchmark model used by the Federal Reserve. These multivariate methods consider historic macroeconomic variables listed below. Explanations for these follow in subsequent sections.
Gross Dometic Product,
Inflation,
Federal Funds Rate,
Commercial Loan Activities, and,
Money Supply (Liquidity).
We further compare models across forecasts over the quarters of a year using mean absolute error and standard deviation. On these metrics multivariate autoregressive model outperformed all the models for shorter forecast horizons, while the univariate neural networks performed better for longer forecast horizons.
What is the Unemployment Rate?
The unemployment rate is defined by the Federal Reserve as follows: “The unemployment rate represents the number of unemployed as a percentage of the labor force.
The Bureau of Labor Statistics (BLS) releases this data every month.
Why is it important to accurately forecast the Unemployent Rate?
The unemployment rate not only gives a measure of joblessness, but also is an indicator of economic growth. This is a lagging indicator and therefore is used to measure the impact of recession whether it is just beginning or is in the decline. It also provides a confirmation of the state of economy when evaluated in combination with other macroeconomic variables. When the unemployment rate increases, as it did during the last financial crisis in 2008, with an unemployment rate of 7 to 8%, which peaked at 10%, the government intervenes by stimulating the economy through a myriad of policy implementation including adding unemployment benefits, adding liquidity into the economy — ‘quantitative easing’, lowering interest rates, and, lowering tax rates to allow access to capital for households and businesses as well as introducing other government spending programs to increase employment opportunities.
Key questions this modeling and analysis is trying to answer:
1. Does including multivariate data improve model performance relative to univariate models?
2. Which multivariate models improve model performance?
3. How do these multivariate models compare with a benchmark consensus forecast from Survey of Professional Forecasters (SPF) at Federal Reserve Bank at Philadelphia.
This article discusses an extension of research conducted by the Federal Reserve at Kansas City (Cook & Hall, 2017), specifically, modeling Unemployment Rate as an univariate time series problem using deep learning architectures.
Univariate time series forecasting of the US unemployment rate do not accurately represent asymmetries which arise from unemployment rate moving countercyclically up during economic contractions and downward in expansions.
The unemployment rate has an inherent contemporaneous dependency of many of the macroeconomic factors. These factors are considered as multiple features, or multiple time series in addition to the time lag (auto-regression) of the dependent variable for forecasting the unemployment rate. Fed Researchers noted that adding more data is expected to improve performance than using a univariate model.
Modeling Approach:
Due to the temporal relationship in the data, CRISP-DM methodology, which is the standard data mining framework, does not work well here.
This analysis is performed using a standardized approach used for time series data (Hyndman & Athanasopoulos, 2021). This original method was enhanced by adding a step for data processing as an explicit step to get the data ready for analysis and modeling. This consists of a six step process:
1. Problem Definition
2. Data Gathering
3. Data Preparation
4. Preliminary (Exploratory) Analysis
5. Choosing and fitting model
6. Evaluating model
Each step is elaborated below:
Problem Definition:
As stated, the main objective of this analysis is to learn if adding relevant variables can improve forecasting accuracy of the US civilian unemployment rate. This data is a time series. Problem definition is generally considered the most difficult part of the process due to the subjectivity of the nature of the problem defined. It is important to know who will be using the forecast and its intended usage. In this analysis, the forecasts are being generated for the purpose of answering important questions stated in the three questions described under the Key Question header above.
2. Gathering Information:
This involved collecting historical data for the purpose of analysis and modeling. Additionally, in this phase, supporting information and knowledge base was applied to interpret the information as well as to understand the analysis. The data source for this analysis leverages publications by the Federal Reserve. Federal Reserve Economic Database (FRED, 2021–2022) is the source used for unemployment data as well as for sourcing other data for this analysis. Table 1 shows the time series data are being used for the multivariate analysis.
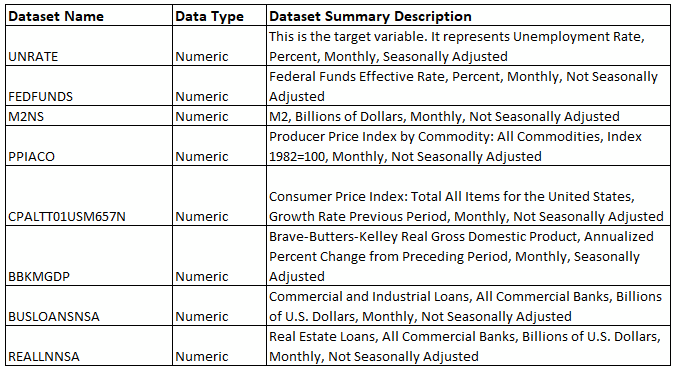
All the data sets are produced monthly and are not adjusted, except for the GDP which is seasonally adjusted as well as Unemployment Rate, the target variable which is also seasonally adjusted. Below is a brief description of each of the variables and how it is related to unemployment.
a. Civilian Unemployment Rate (UNRATE): This is the target variable. The unemployment rate represents the number of unemployed as a percentage of the labor force. This includes individuals 16 and above in the 50 US states. It excludes active-duty personnel. This is the variable used for forecasting in this analysis.
b. Fed Funds Rate (FEDFUNDS): The federal funds rate is the interest rate at which depository institutions trade federal funds (balances held at Federal Reserve Banks) with each other overnight. When a depository institution has surplus balances in its reserve account, it lends to other banks in need of larger balances. In simpler terms, a bank with excess cash, which is often referred to as liquidity, will lend to another bank that needs to quickly raise liquidity.
The federal funds rate is the central interest rate in the U.S. financial market. It influences other interest rates such as the prime rate, which is the rate banks charge their customers with higher credit ratings. Additionally, the federal funds rate indirectly influences longer term interest rates such as mortgages, loans, and savings, all of which are very important to consumer wealth and confidence according to the Board of Governors of the Federal Reserve System. (FRED, 2021–2022)
c. Money Supply (M2NS): This is one of the measurements (of the three — M1, M2, M3) of United States money supply, also known as the money aggregates. M1 includes money that is in circulation at a given time including checkable deposits in banks, whereas M2 includes M1 plus saving deposits (less than $100,000), and money market mutual funds. M3 includes M2 plus large time (fixed) deposits. The reason M2 is chosen as it is the most watched indicator of money supply and future inflation. The less the money supply, the less liquidity in the system. Optimal level of liquidity is important for access to capital for businesses to continue and expand their operations which further ensures unemployment rates are kept in check.
d. Producer Price Index (PPIACO): This measure provides information on the price index similar to CPI which is generally used for consumer price index (inflation as more commonly known). PPIACO is used as a leading indicator to predict consumer price increases, as it follows a producer price increase. When PPI increases, the cost of raw materials increases and therefore cost of doing business increases. When this price increase is not passed down to the end consumer or is marginally passed down, employers bear the brunt of the cost pressures, putting a risk to employment for the workforce.
e. Inflation (CPALTT01USM657N): This represents CPI (consumer price index) described in section d above. When CPI increases, demand for certain type of goods, services contract. Sustained inflation without intervention from the central bank and Fed can further hurt business sales, and therefore margins, increasing unemployment risk as inflation combined with economic slowdown continues over longer term.
f. GDP Growth (BBKMGDP): Gross Domestic Product (GDP) is the measure of economic activity of a country. It is measured as the total market value of goods and services produced by an economy during a given period. GDP is published only quarterly. An alternative GDP measure is being used here referred to as Brave-Butters-Kelley Monthly GDP. This measure is published by the Fed as a monthly time series data. All data used in this analysis is monthly.
g. Commercial & Industrial Business Loan activity (BUSLOANSNSA): This measure provides commercial lending and is indicator of capital usage by the businesses. A strong loan demand is indicative of demand for labor and therefore a lower unemployment rate.
h. Commercial Real Estate Business Loan activity (REALLNNSA): This measure is similar to the commercial lending activity, except it is specifically for commercial real estate which includes physical properties used for commercial purposes. In an expanding economy with newer offices, facilities, and factories, jobs are expected to be increasing reducing unemployment rate. Both g and h are leading indicators of unemployment rate.
The last two variables described above for business loan activity was not actively found to be used in macroeconomic forecasting literature. However, based on economic theories, we understand that access to capital through loans helps companies plan for growth which requires hiring workforce among other investments, and, therefore higher the loan activity under a rising GDP environment, there is an expectation that the employment rate will be higher. Consequently, the unemployment rate will be lower. After conducting exploratory data analysis, the last two variables were subsequently dropped from modeling.
In part 2 of this series, we will continue the article starting with the data preparation needed for this analysis and modeling.
Until next time.
References:
Cook, T., & Hall, A. S. (2017). Macroeconomic Indicator Forecasting with Deep Neural Networks. Retrieved from dx.doi.org: https://dx.doi.org/10.18651/RWP2017-11
FRED. (2021–2022). Fed Reserve Economic Research. Retrieved from Fed Reserve Economic Data: https://fred.stlouisfed.org/
Hyndman, R., & Athanasopoulos, G. (2021). https://otexts.com/fpp3/. OTexts.
Karpathy, A. (2015). Retrieved from http://karpathy.github.io/2015/05/21/rnn-effectiveness/
Katris, C. (2019). Prediction of Unemployment Rates with Time Series and Machine Learning Techniques. Computational Economics, 682.
Lower, Eric. (2021). Introduction to the Fundamentals of Vector Autoregressive Models. Retrieved from Aptech: https://www.aptech.com/blog/introduction-to-the-fundamentals-of-vector-autoregressive-models/
Montgomery, A., & Zarnowitz, V. (1998). Forecasting the US Unemployment Rate. Journal of the American Statistical Association, 478.
SPF. (2022). Survey of Professional Forecasters. Retrieved from Federal Reserve Bank Philadephia: https://www.philadelphiafed.org/surveys-and-data/real-time-data-research/survey-of-professional-forecasters